Today we’re chatting with Aurelien Rainone, a developer at Develer who recently led one of our techLabs at The Student Hotel in Florence.
In this interview, Aurelien gives us a concise overview of his workshop, walking us through the key concepts of monitoring a Go application and how to make the most of the available tools.
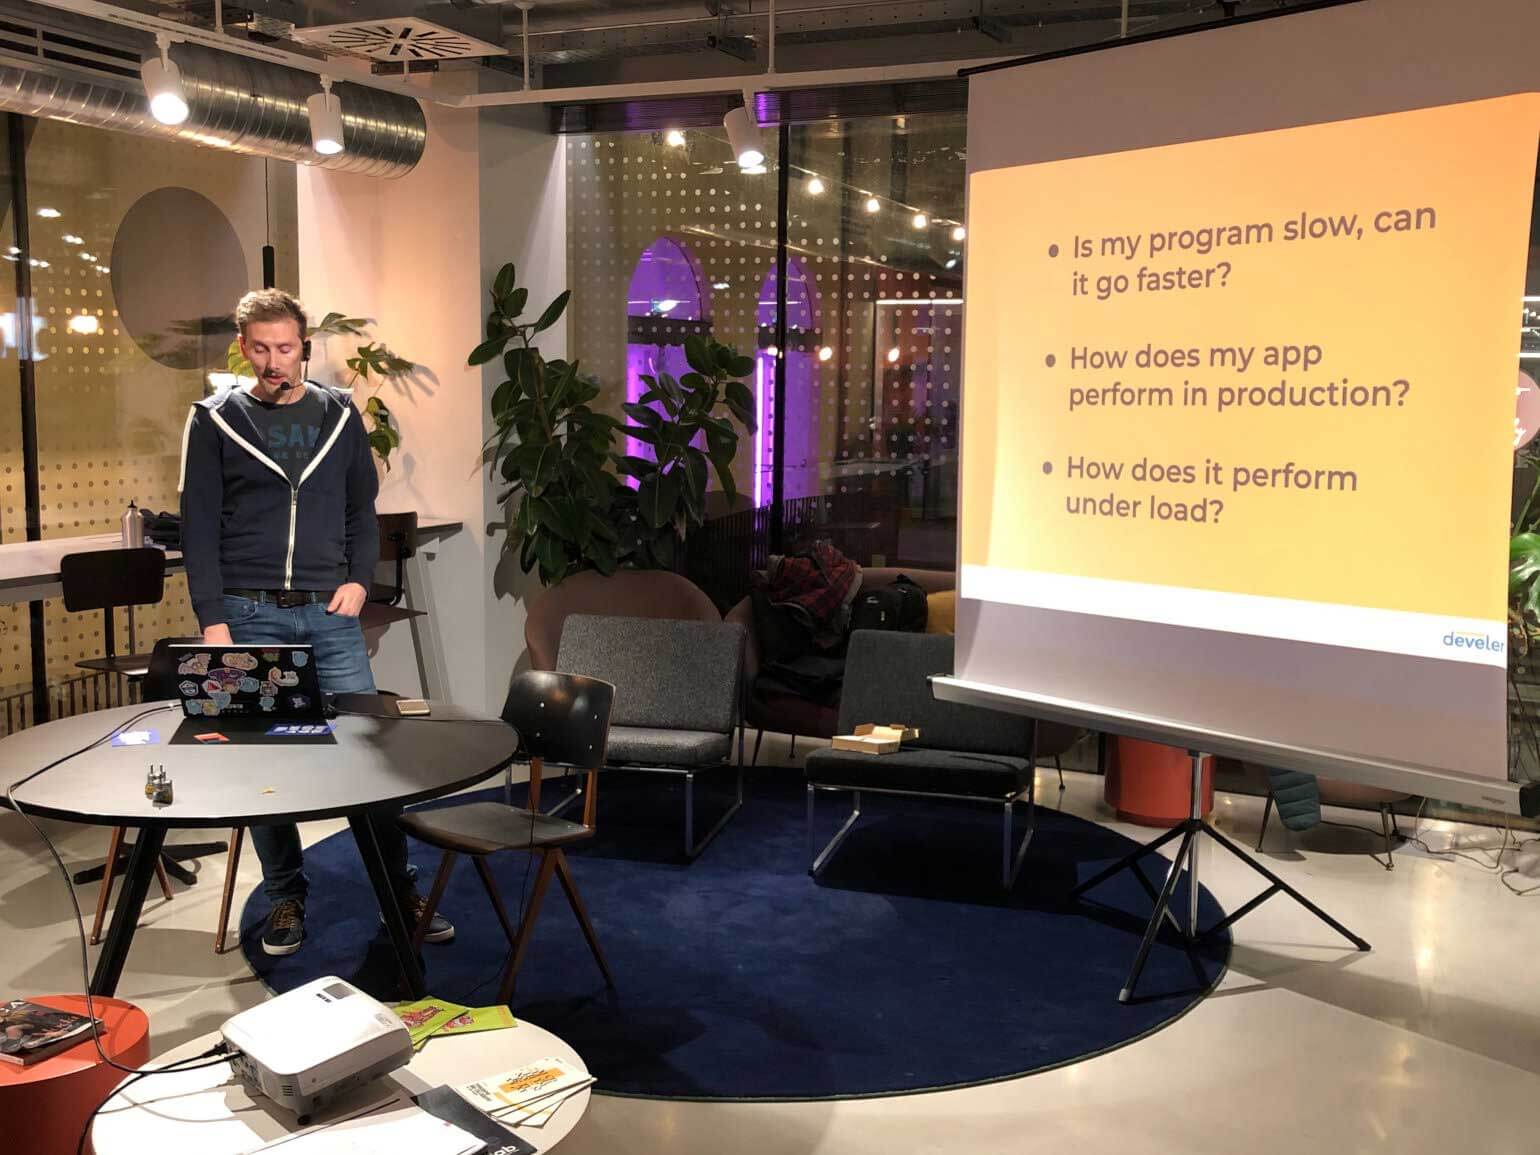
Hi Aurelien! Based on your experience, what are the most common challenges when it comes to monitoring an application?
The issues are pretty typical: is the program running too slowly? Why is that happening? Can we make it faster? What’s the app’s behavior like in production? How does it perform under load?
What tools can we use to tackle these problems?
In the first part of the workshop, we focused on tools that come bundled with the Go language itself. Just by installing Go, you already have access to several useful tools: an execution tracer, a profiler, and built-in support for writing and running benchmarks.
In Go, writing a benchmark is as simple as creating a function that starts with the word Benchmark (for example, BenchmarkMyFunction). The testing package offers a lot of functionality out of the box, allowing you to thoroughly test your code without the need for third-party tools.
What are the differences between these tools?
The execution tracer is a graphical tool that helps you understand when certain events happen in the Go runtime—such as goroutine scheduling or race conditions.
The profiler gives you detailed insights into specific functions or blocks of code. You can use it to analyze CPU or memory usage, identify performance bottlenecks, and optimize your application accordingly.
In the second part of the workshop, we covered real-time monitoring with Prometheus, a time-series database (TSDB). We explored the kinds of metrics you can monitor and how to use them effectively.
Since Prometheus isn’t included in the Go distribution, it needs to be installed separately. During the hands-on portion of the workshop, participants learned how to monitor an HTTP server in real time using a Prometheus and Grafana stack set up via Docker Compose.
So, is there a “best” tool to use?
Not really—there’s no one-size-fits-all tool. It all depends on the situation.
For example, if I know a function is running a bit slowly and I want to optimize it, I’ll write a benchmark to measure the execution time and track performance improvements. On the other hand, if I don’t know where my program is spending the most time, I’ll use the profiler to find the bottlenecks.
And if I’m running a 24/7 HTTP server and need continuous monitoring, I’ll use Prometheus. It lets me track CPU and memory usage in relation to the number of open connections and helps assess performance under load.
Ultimately, experience is what guides you. Once you’re familiar with the different tools, you’ll know which one to use depending on the problem you’re trying to solve.
To stay updated on upcoming events, follow us on social media or subscribe to our newsletter.
Stay up to date on Develer events
Subscribe to receive updates about the events we organize