Go pain points on embedded systems
Go is a new generation language, which holds both Python’s fast prototyping and C/C++ applications performance. This trait made it suitable to be used in embebbed field as well, but which considerations have to be made in order to achieve good results?
Requirements of embedded applications
The real time property is the main characteristic of an embedded application, that is the ability to promptly react to a certain event, both internal and external. The reaction time may be slow of fast, but it’s mandatory to be deterministic. When we develop a program in Go, we have to take into account to rely on a runtime framework which we cannot totally control. In particular, Go has a garbage collector (GC) that takes action as a consequence of objects allocations and these software events are handled by the runtime. Thus we have to limit as much as possible any factors they might interfere with our program’s hot path, leading to unexpected latencies.
A very important aspect is the performance, since boards usually have a more limited computational power, comparing to a desktop system. However, recently it’s possible to find on the market faster and faster embedded boards, even multicore, hence the classic approach that is based on a single managing main loop doesn’t scale anymore. Thus even an embedded application needs to exploit more than one core, by executing operations in parallel.
Go is a simple language, self-contained and fast. For these reasons, it places itself well in the embedded world. In this article I will use, as reference, Go version 1.11.
Important aspects to evaluate
Let’s consider an application that runs on an embedded system with a GNU/Linux operating system. Generally speaking, the most important aspects to evaluate, to achieve a correct operation, are the following:
- Usage of data structures and efficient algorithms.
- Optimization of the critical path, that is the principal task.
- Interaction with peripherals.
- Concurrent tasks.
- Memory management.
The former two points are quite generic, in the sense that, independently from the chosen language, we shall pick some data structures and algorithms that are efficient, in order to optimize the principal task our embedded system has to carry on. For example, generally speaking, we would want to avoid to do computations with a O(n^2) complexity, or to be blocked for a long time on some syscalls and so on.
Concerning the interaction with peripherals, Go provides most of the operating systems’ syscalls, so there shouldn’t be communication problems. However, a Go idiomatic code relies on some paradigms which also have an impact on the performance. Let’s see what are the best practices to follow in order to get an efficient program.
I/O operations
The I/O management is a very important part but it must be designed in a different way, comparing to how it is usually done for an embedded application, when we program in Go. Indeed, generally speaking, the concept of non-blocking API doesn’t really exists in Go. One of the several basic interfaces in Go is io.Reader, that defines a blocking Read method. Hence, in the need of reading either from a file descriptor or from a TCP connection, for example, the method gets blocked until some data arrives or the stream is closed. Conversely, programming in C++, we can read from multiple streams at the same time, until at least one of them becomes readable.
Let’s see a simple example in C/C++:
#include <stdio.h>
#include <unistd.h>
#include <string.h>
#include <sys/poll.h>

int main(int argc, char **argv) {
    struct pollfd fds[1];

    // watch stdin for input
    fds[0].fd = STDIN_FILENO;
    fds[0].events = POLLIN;

    while (1) {
        const int timeout_msecs = 5000;
        const int ret = poll(fds, 1, timeout_msecs);
        if (ret <= 0)
            break;

        if (fds[0].revents & POLLIN) {
            char buf[32];
            memset(buf, 0, sizeof(buf));
            const int n = read(fds[0].fd, (void *)buf, sizeof(buf)-1);
            if (n < 0)
                break;

            printf("stdin has input data: %s\n", buf);
        }
    }
}
By mean of the poll syscall, notifications are received regarding which file descriptors are readable (even more than one). Thus if we have to read from multiple TCP connections, it’s possible to use the same thread to perform non-blocking readings, preventing to be stuck waiting on a connection which has no input data. Whenever new data is available, we can decide how to handle them, depending on where the receiving function is located, either the principal thread or another parallel one. However, at most we will have to synchronize two threads each others, with mutexes or through an inter-process socket.
Let’s see the same example written in Go:
package main

import (
    "fmt"
    "os"
    "time"
)

func main() {
    ch := make(chan string)

    go func(ch chan<- string) {
        buffer := make([]byte, 32)

        for {
            n, err := os.Stdin.Read(buffer)
            if err != nil {
                close(ch)
                return
            }
            ch <- string(buffer[:n])
        }
    }(ch)

    for {
        select {
        case s, more := <-ch:
            if !more {
                return
            }
            fmt.Println("data from stdin:", s)

        case <-time.After(5 * time.Second):
            return
        }
    }
}
In the above example a reading Goroutine was started, that is valid for just one input stream. If we had more streams to read from, we should start other Goroutines that run concurrently with respect to the principal loop. Therefore the execution flow of a Go program is different and the available cores can be exploited in a more natural way. In the previous example we also used a channel to send data to the main loop.
For these reasons, what is the best way to share data among different Goroutines? Available chances are mainly related to the usage of either a channel or a mutex.
Concurrent tasks
Suppose that we have a software in Go that is written as shown in the previous listing. We receive data from multiple input TCP connections and there is a main management Goroutine that is in charge of data processing. As already said, the idiomatic Go way to handle this situation is to run one Goroutine for every TCP connection, as shown in the following figure:
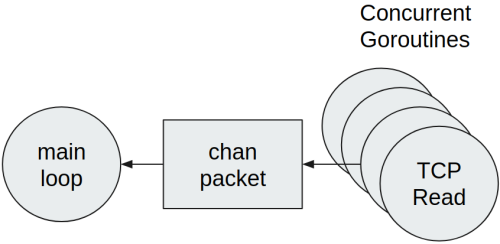
Every Goroutine runs the same code:
- Read data from the network.
- Decode data into Go structures.
- Send packets to the main loop.
A Go channel was chosen for the communication between every Goroutine and the main loop. Moreover, every received packet from the network is sent through the channel individually. This method is correct, however it is not efficient when the number of received packets is high. Every channel writes leads to:
- Access to synchronization primitives, since channels are thread-safe.
- Handling a lot of reading events in the receiving Goroutine.
It follows that the main loop is not able to promptly handle every received packet. Generally speaking in these cases, using a slice of elements is a variation that can help, thus reducing the number of channel writes:
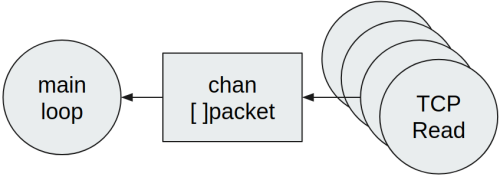
Therefore, in case multiple packets are read from a network connection, grouping them all together with a slice is worthwhile, thus writing just the slice to the channel. This solution is better than the previous one if we want to reduce the latency between the reception of a packet and its subsequent processing. The main disadvantage however is related to the higher pressure of the Go garbage collector, since every slice shall likely have pointers to the contained packets, thus also those packets shall be released by the GC. We will see later how to improve the memory management.
Since the dynamic creation of objects or slices is not optimal, another possible solution is to use a mutex, in order to share data with the main loop:
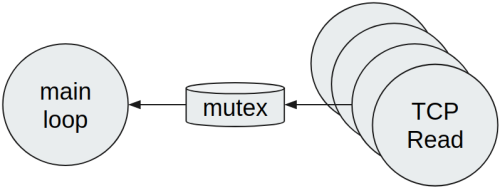
This solution immediately has some disadvantages. First of all, the mutex is shared among many Goroutines and the contention is very high, thus it will be a bottleneck. We also have to consider that Go scheduler is cooperative, so every Goroutine is put in execution when another one reaches a synchronization point or it calls a syscall. For this reason, a single shared mutex increases the Goroutine scheduling pressure and the data reception might not be fair anymore. If we really want to follow this way, depending on how data is partitioned, it’s possible to apply a shardening approach, so that the contention of a single mutex is avoided.
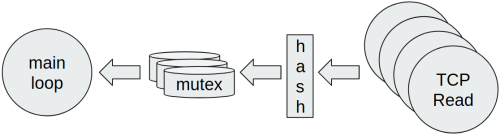
In order to do this, we have to define a hash function to map every packet into its data partition. In this way the contention among concurrent Goroutines is lowered, but it’s still necessary to take into account potential conflicts. Thus the contention is less than before, but it won’t be exactly zero. The hash function may be designed based on some configuration parameters and sometimes it can also be skipped, if it’s possible to separate data by mean of some project logic (for example by source IP address, fields contained in packets, etc…).
Please note the poll syscall can be used also in Go, thus reducing the total number of Goroutines to just one. Anyway this approach is not idiomatic and it’s not a tipical use case.
Memory management
Usage of system memory is a very important aspect to keep under control when developing embedded applications. Go has its own logic to perform GC and a detailed description of this topic is beyond the goal of this article. It is sufficient to understand that the GC pressure increases as much memory is allocated. This leads the GC to take action more frequently, even causing a stop-the-work in part, that is a full stop of the main execution flow. Thus the GC can cause unexpected latencies in an embedded system that we want to maintain under a certain threshold. In the next paragraphs, we will see how we can limit the effects of the GC.
Memory dynamic allocation
The GC’s job is to find which memory parts are not used anymore, by finding every pointer to a memory allocation. Hence, by using more memory, the time spent in this kind of search and clean will raise. If software needs a high amount of memory, then there might be a performance issue. A simple way to overcome this problem is to avoid pointers, using arrays of objects by value.
Let’s try to measure how much time is spent by the GC, in two tests:
- A: dynamic allocation of elements without pointers.
- B: dynamic allocation of elements with pointers.
package main

import (
    "fmt"
    "runtime"
    "time"
)

type A struct {
    value int
}

func testA() {
    arr := make([]A, 1e6)
    runGC()
    arr[0] = A{}
}

type B struct {
    value *int
}

func testB() {
    arr := make([]B, 1e6)
    runGC()
    arr[0] = B{}
}

func runGC() {
    t0 := time.Now()
    runtime.GC()
    fmt.Printf("test duration: %s\n", time.Since(t0))
}

func main() {
    testA()
    testB()
}
test duration: 224.338µs
test duration: 5.023066msIt is clear from the results that GC takes more time to scan memory which contains pointers. Note that this behavior is not present anymore if arrays are statically preallocated, like it sometimes happens in embedded applications.
There are however some kind of Go objects that contain pointers internally. In these cases we have to pay attention when we allocate structures that are containing them. Two examples of these objects are time.Time and string.
What can we do if we can’t avoid dynamic allocations?
It is not always possible to avoid the usage of dynamic memory. Continuing with the network packets example, we saw that using a slice of elements may help to reduce the number of channel writes. In this case, it’s mandatory to allocate a slice of the right size, in order to send it to the communication channel.
In the following listing we can see many slices of integers which are sent to the channel by a concurrent Goroutine, towards the main Goroutine. In order to perform a more accurate calculation, the GC was disabled through the debug.SetGCPercent(-1) instruction, executing the GC task just one time at the end of the test.
package main

import (
    "fmt"
    "runtime"
    "runtime/debug"
    "time"
)

func main() {
    // let's disable the GC
    debug.SetGCPercent(-1)

    ch := make(chan []int)

    go func(ch chan<- []int) {
        for i := 0; i < 1e6; i++ {
            ch <- make([]int, 3)
        }
        close(ch)
    }(ch)

    {
    loop:
        for {
            select {
            case _, more := <-ch:
                if !more {
                    break loop
                }
            }
        }
    }

    t0 := time.Now()
    runtime.GC()
    fmt.Printf("GC duration: %s\n", time.Since(t0))
}
GC duration: 1.352792msThe total GC time is similar to the previous tests, when memory pointers are used. This is normal since we are allocating many slices. In order to mitigate this allocation issue, we can consider the usage of a sync.Pool. This object serves to manage allocation of dynamic memory, by reusing already allocated object previously. Let’s see how we can modify the previous example for this goal:
package main

import (
    "fmt"
    "runtime"
    "runtime/debug"
    "sync"
    "time"
)

type mySlice struct {
    Val [3]int
}

func main() {
    // let's disable the GC
    debug.SetGCPercent(-1)

    ch := make(chan *mySlice)

    pool := sync.Pool{
        New: func() interface{} {
            return &mySlice{}
        },
    }

    go func(ch chan<- *mySlice) {
        for i := 0; i < 1e6; i++ {
            ch <- pool.Get().(*mySlice)
        }
        close(ch)
    }(ch)

    {
    loop:
        for {
            select {
            case s, more := <-ch:
                if !more {
                    break loop
                }
                pool.Put(s)
            }
        }
    }

    t0 := time.Now()
    runtime.GC()
    fmt.Printf("GC duration: %s\n", time.Since(t0))
}
GC duration: 191.448µsThe garbage collection time is now considerably reduced! However we had to apply some modifications. First of all, whenever we want to instantiate an object, we have to call the sync.Pool.Get() method. In the same way, once the object was used, it can be subsequently released through the sync.Pool.Put() method. sync.Pool is thread-safe, thus these methods can be called from different Goroutines. Moreover, since these objects are reused, it’s important to perform a Clear of their contents, just after a Get or just before a Put.
Another modification we made is the definition of the mySlice structure, which represents a slice with a fixed number of elements. Obviously, it happens often to not be aware of how many elements we have to store. For this reason, we can add a Size member variable that holds the actual number of used slots. To notice that it should be better to avoid this approach, in order to not reinvent the Go slice data type. For this reason, it’s advisable to have a structure which is defined in this way:
type mySlice struct {
    Val []int
}

func (ms *mySlice) Clear() {
    for i := range ms.Val {
        ms.Val[i] = 0
    }
    ms.Val = ms.Val[:0]
}
Elements will be added to the slice with the usual append function. Moreover, it’s very important that Clear will reset the actual used used elements, before resetting the slice variable itself with ms.Val[:0]. This instruction creates a copy of a slice with zero elements, that is pointing to the same already allocated underlying array. In fact, if the underlying array were reallocated every time, the usage of sync.Pool would provide no benefits.
Closure and escape analysis
Go language allows the definition of anonymous functions and, more generally, closures. While the former are not usually a performance issue, the latter can be instead. A Go closure is actually an object which holds a state the function must operate upon. If there are tasks which intensively use closures, then GC operation timing can degrade once again. Therefore better to not use closures from within the program’s critical path, unless the compiler is able to avoid the heap usage. This optimization is called escape analysis and it’s used to determine whether there are some references which are escaping the function boundaries where they were declared. If no references are escaping, then the value can be placed on the function’s stack, so there is no need of further allocations and to subsequently release that memory. Rules of escape analysis are not part of the Go language specifications, thus they may change from version to version.
package main

import "os"

func adder(x, y int) func() int {
    return func() int {
        return x + y
    }
}

func main() {
    ret := adder(1, 3)()
    os.Exit(ret)
}
Here it is the output of the program’s execution, by enabling escape analysis with the -gcflags '-m' parameter.
$> go run -gcflags '-m' foo.go
./foo.go:6:9: can inline adder.func1
./foo.go:6:9: func literal escapes to heap
./foo.go:6:9: func literal escapes to heap
exit status 4
We can see that the returned adder function is allocated in the heap memory. The previous program can be rewritten with a “context” structure, by converting the closure to a such object’s method.
package main

import "os"

type context struct {
    x, y int
}

func (c context) Add() int {
    return c.x + c.y
}

func main() {
    ret := context{1, 3}.Add()
    os.Exit(ret)
}
We can verify that now values are all allocated on the stack.
$> go run -gcflags '-m' foo.go
./foo.go:9:6: can inline context.Add
./foo.go:14:26: inlining call to context.Add
<autogenerated>:1: (*context).Add .this does not escape
exit status 4
Logging can be expensive
In an embedded system, like in every other else, it is fundamental to have informative or error printings. Through logging it is possible to analyze what’s happening and if the software is operating well. In Go, when we want to print messages, we can use the standard library by mean of the fmt package functions. But, this is how Printf function is defined:
func Printf(format string, a ...interface{}) (n int, err error)From the performance point of view, there are multiple issues and they are mainly related to the second parameter. In fact, the interface{} data type cannot be evaluated at compile time, hence it causes both an allocation and the need of the runtime determination of the actual type. For instance, we can see in the following example program, that even a constant value is moved to heap memory.
package main

import "fmt"

func main() {
    fmt.Printf("%d\n", 1)
}
$> go run -gcflags '-m' foo.go
./foo.go:6:21: 1 escapes to heap
./foo.go:6:12: main ... argument does not escape
1A very useful library to manage logging in an efficient way is zerolog, which allows also setting the log level of every message. More in detail, if our program emits many debug messages, they will have a very limited impact, almost zero. Instead, if we don’t take care of such aspects, then even debug messages can lead to a performance degradation, also when the general log level is above debug (thus the actual printing is not even performed).
By executing the escape analysis on the next program which is using zerolog, we can have the proof that no dynamic allocations are present.
package main

import "github.com/rs/zerolog/log"

func main() {
    log.Info().Int("val", 1).Msg("")
}
$> go run -gcflags '-m' foo.go
{"level":"info","val":1,"time":"2019-01-30T17:18:20+01:00"}Conclusions
This article provides some introductory concepts in order to use Go in an embedded field. I tried to list the most important points to take care of when we want to write efficient software.
Briefly summing up, we saw that Go allows exploiting the most recent CPU architectures, thanks to concurrent model of its runtime. Concerning synchronization, the usage of channels is idiomatic, better by grouping data to write in slices. Mutexes are still useful, but paying attention to not cause bottlenecks among Goroutines. Moreover, especially for embedded applications, it’s fundamental to keep GC timings under control. In order to reduce allocations, we can use sync.Pool, reuse already created slices, or avoiding closures. Finally, even logging can be costly, with respect to allocations, thus it’s convenient to rely on a specific library which was just written to overcome this issue.
Generally speaking, however, it is not mandatory that the code shall be totally optimized, but we can do it just for the main execution flow. In fact, this is not strictly necessary, since clear and simple code is always better than a more complex but more efficient one. Actually, a Go program usually fits situations where high performance is needed, hence the rule of avoiding premature optimization is still valid.