
Metrics: why and how
Author: Lorenzo Berni
Sometimes during the development of web services, there is a tendency to give low consideration to both performance monitoring and service usage. Maintaining a system including metrics and adequate visualization will allow us to find any bottlenecks and bugs before they even occur.
My use case
I was confronted with the topic of metrics when I was asked to monitor the performance of a REST API, to check which endpoints were most stressed and to take account of the HTTP response codes. To these parameters, strictly related to the API, I then added further metrics related to the use of the underlying databases and the related performance.
The analysis of metrics allows, at a glance, the immediate identification of certain anomalous API behaviors, behaviors that would otherwise go completely unnoticed for a long period of time.
Although reasonable, the requirements of a metric system are stringent:
- impact tending to zero on API performance
- fail-proof metrics: the API should work without problems even in the event of a malfunction of the metric collection system
- the simplicity of adding new parameters to monitor
- the simplicity of adding new views on these parameters
Why Grafana
There are many reasons why I turned to Grafana:
- it is an open source project, stable and equipped with a decidedly comprehensive documentation
- it is extremely configurable and expandable
- it is actively developed and maintained
- it is used by many big names in the – StackOverflow sector, to name just one of many
- the graphs and views generated are definitely pleasing to the eye: the visuals are of course important
- it was already in use for the monitoring of a number of secondary services 😀
Interesting metrics for a REST API
Filling your API with metrics is not only a useless exercise but can actually be counter-productive. For this reason, it is always advisable to perform a thorough analysis of what needs to be monitored. Receiving tons of useless alerts is barely more useful than not receiving them at all.
Here are some parameters that might be interesting to monitor:
- HTTP error codes: although it is completely permissible to return error codes, recognizing at a glance a sudden wave can help in subsequent investigations.
- internal errors: decidedly less legitimate than the previous ones, these are alarm bells for possible bugs.
- performance of the various endpoints: it is interesting to know if the API is losing too much time behind something in particular. There could be problems with the services it supports. An excessively high load on the server or even a hardware problem.
- registry of API users: users, clients, any device. Understanding who is using the API, how many of them there are and what is the key to finding insidious bugs in users.
- underlying system: it is important, as far as possible, to also monitor the services on which the API relies, such as databases or other APIs. Furthermore, it is important to have the health indicators of the hardware on which the API is listening.
While it is not recommended to add large quantities of uninteresting parameters, it is instead of fundamental importance to attach to these metrics as much information as possible: knowing that many errors are occurring in requests is a good starting point, but knowing that these errors are caused by Android users located in the United States via the app updated to its last version released a few hours earlier is much more useful.
Details on the metric stack
statsd
At the first level of the stack, immediately in contact with the REST API is statsd, with which it is communicated via a statsd-client, a simple Python module that implements the communication protocol via UDP. Statsd has been chosen for this thankless task due to its ability to store the metrics received and to generate output as well as the aggregates themselves.
InfluxDB

Due to the persistence of the accumulated data InfluxDB was chosen, a robust database, written in go, on which it is possible to make queries using a SQL-like language. InfluxDB was created with the aim of storing data series time, and is highly performing both in the save phase and in the query phase. It also maintains filesystem data in an extremely compact format. Communication between statsd and InfluxDB takes place via the graphite protocol.
Grafana
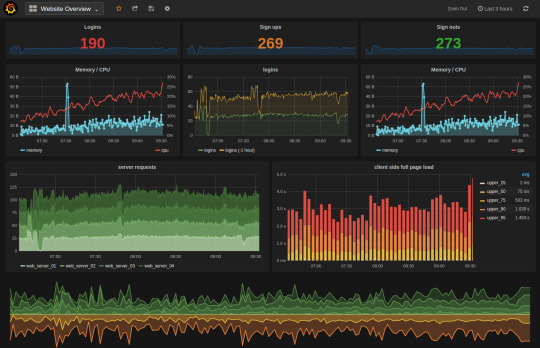
The visualization, instead, as written above is delegated to Grafana.
Grafana supports countless data sources, including InfluxDB and provides graphical tools within the web app itself to simply configure queries and to change the appearance of the results display.
Conclusions
I was very satisfied with Grafana as well as with the entire stack dedicated to metrics. And yet I found the graphical dashboard configuration interface on Grafana very cumbersome. In addition, another flaw that I found was the impossibility of being able to configure a series of dashboards ready to be used on a clean installation of Grafana itself, so that to build a reproducible and working environment on docker I was forced to write scripts that import dashboards on first boot using the Grafana HTTP API.
Remove statsd from the stack
Although it is a mature and reliable tool, at the end of the project I came to the conclusion that it was not worthwhile including an entire additional service solely and exclusively to obtain temporary aggregates: InfluxDB is sufficiently powerful and performing to be able to carry out aggregations on-the-fly. In the final setup of the project, eliminating statsd would have meant removing an additional dependency, with the related configuration and maintenance issues.
Give the TICK stack offered by InfluxData a chance
Another point that – considering infinite time and budget – I would certainly have addressed is a possible migration to the entire TICK stack made available by InfluxData (the creators of InfluxDB)
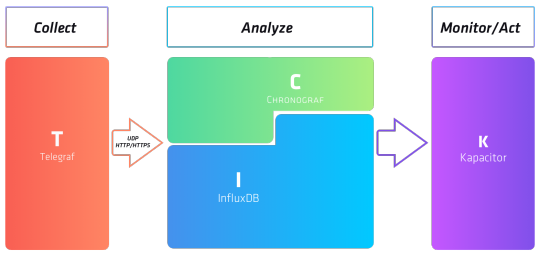
This stack consists of:
- Telegraf: the statsd counterpart offered by InfluxData
- InfluxDB
- Chronograf: the Grafana counterpart offered by InfluxData
- Kapacitor: an InfluxDB programmable data processing engine, which can be used to receive notifications of outdated thresholds, patterns in metrics and whatever your imagination is able to conceive.